Portable, performant access to advanced 3D rendering engines.
In November 2019, Khronos announced the creation of the Analytic Rendering Exploratory Group, with the intent to investigate industry interest in creating an open API for data visualization. Then in March 2020, with strong industry support, Khronos created the ANARI Working Group to begin developing an open, higher level analytics rendering interface API for visualization (See TechWatch). ANARI stands for ANAlyticRendering Interface and is pronounced, ANN-ARE-EE.
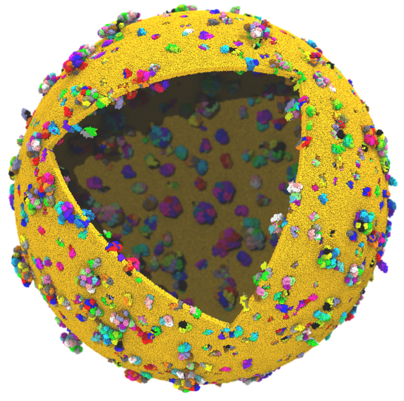
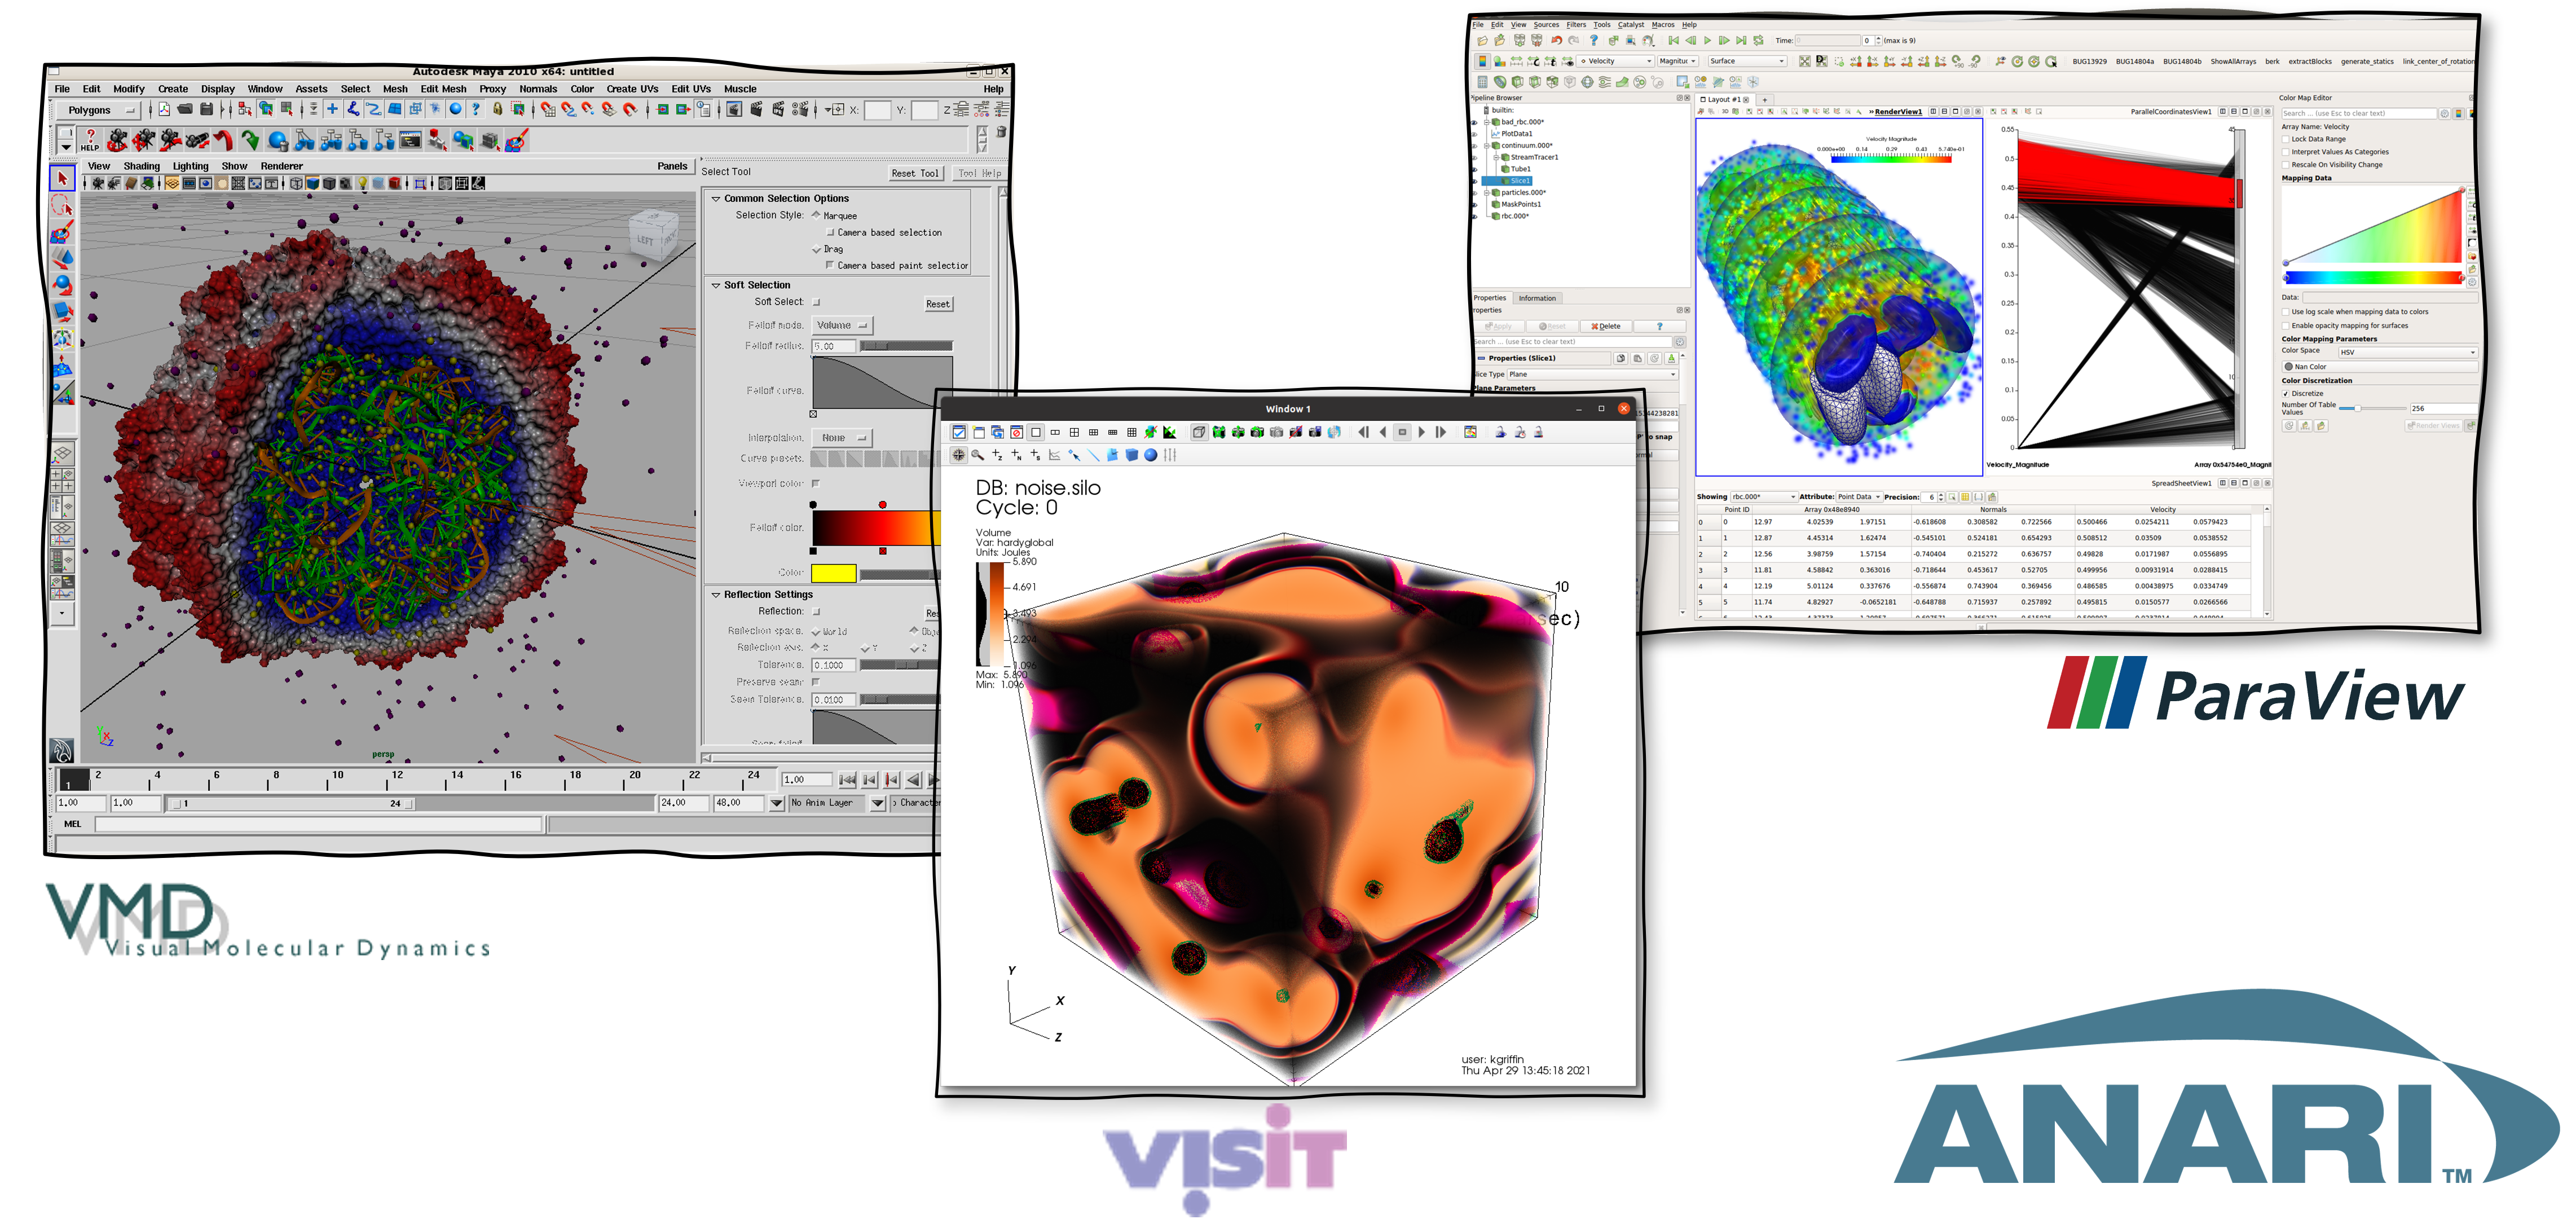
3D visualizations help scientific and engineering researchers, economists, sociologists understand the relations of complex situations and gain insights from large quantities of complex data. And they run on supercomputers that are solving big problems.
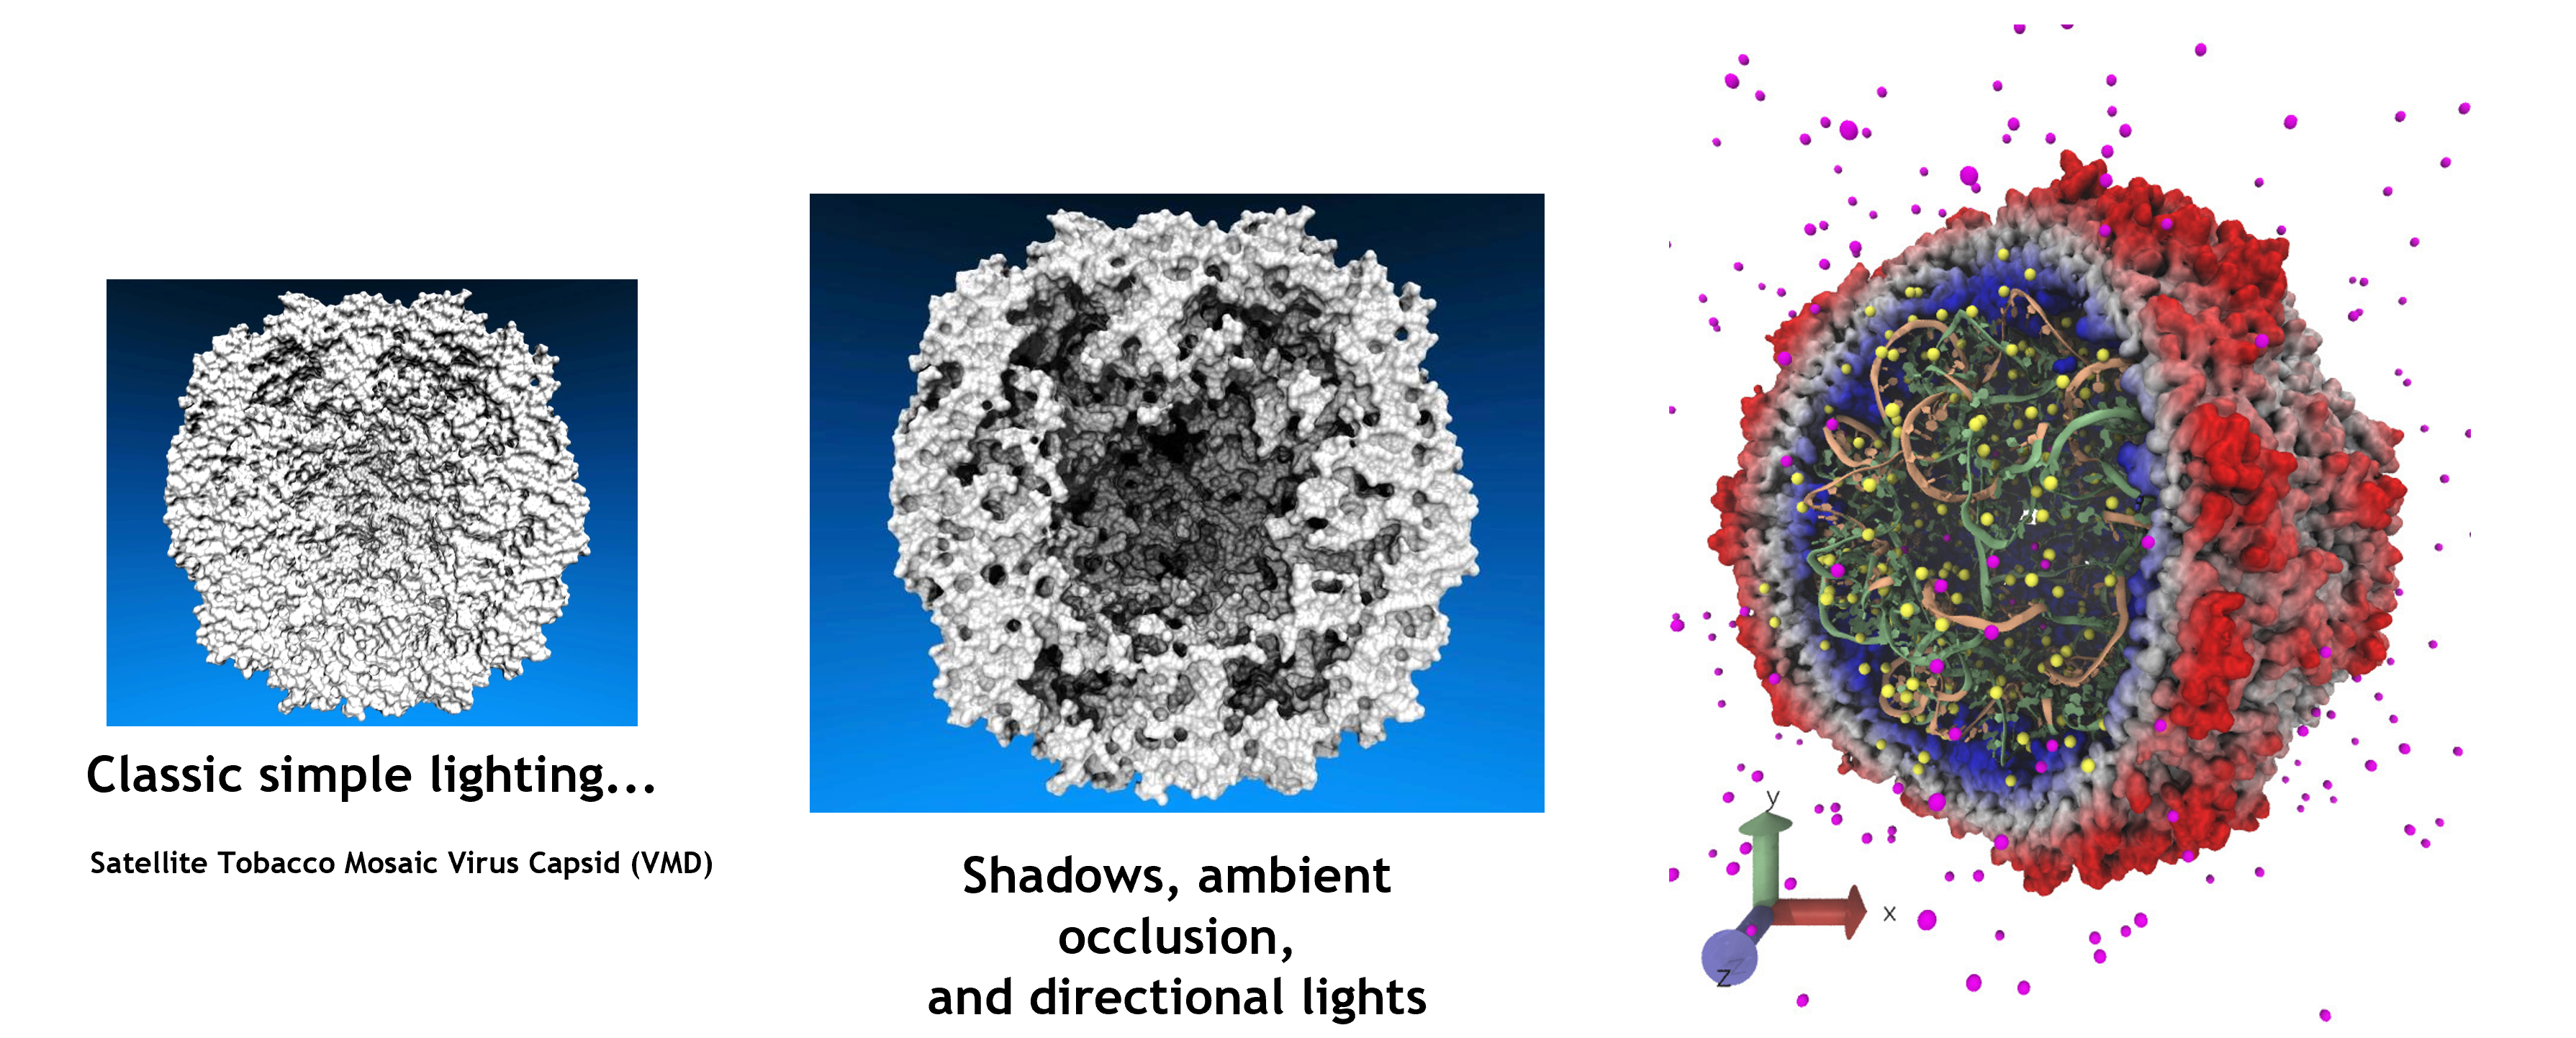
Advanced rendering techniques, including ray tracing, improve the perception of complex 3D geometry and spatial relationships within a visualization, but,
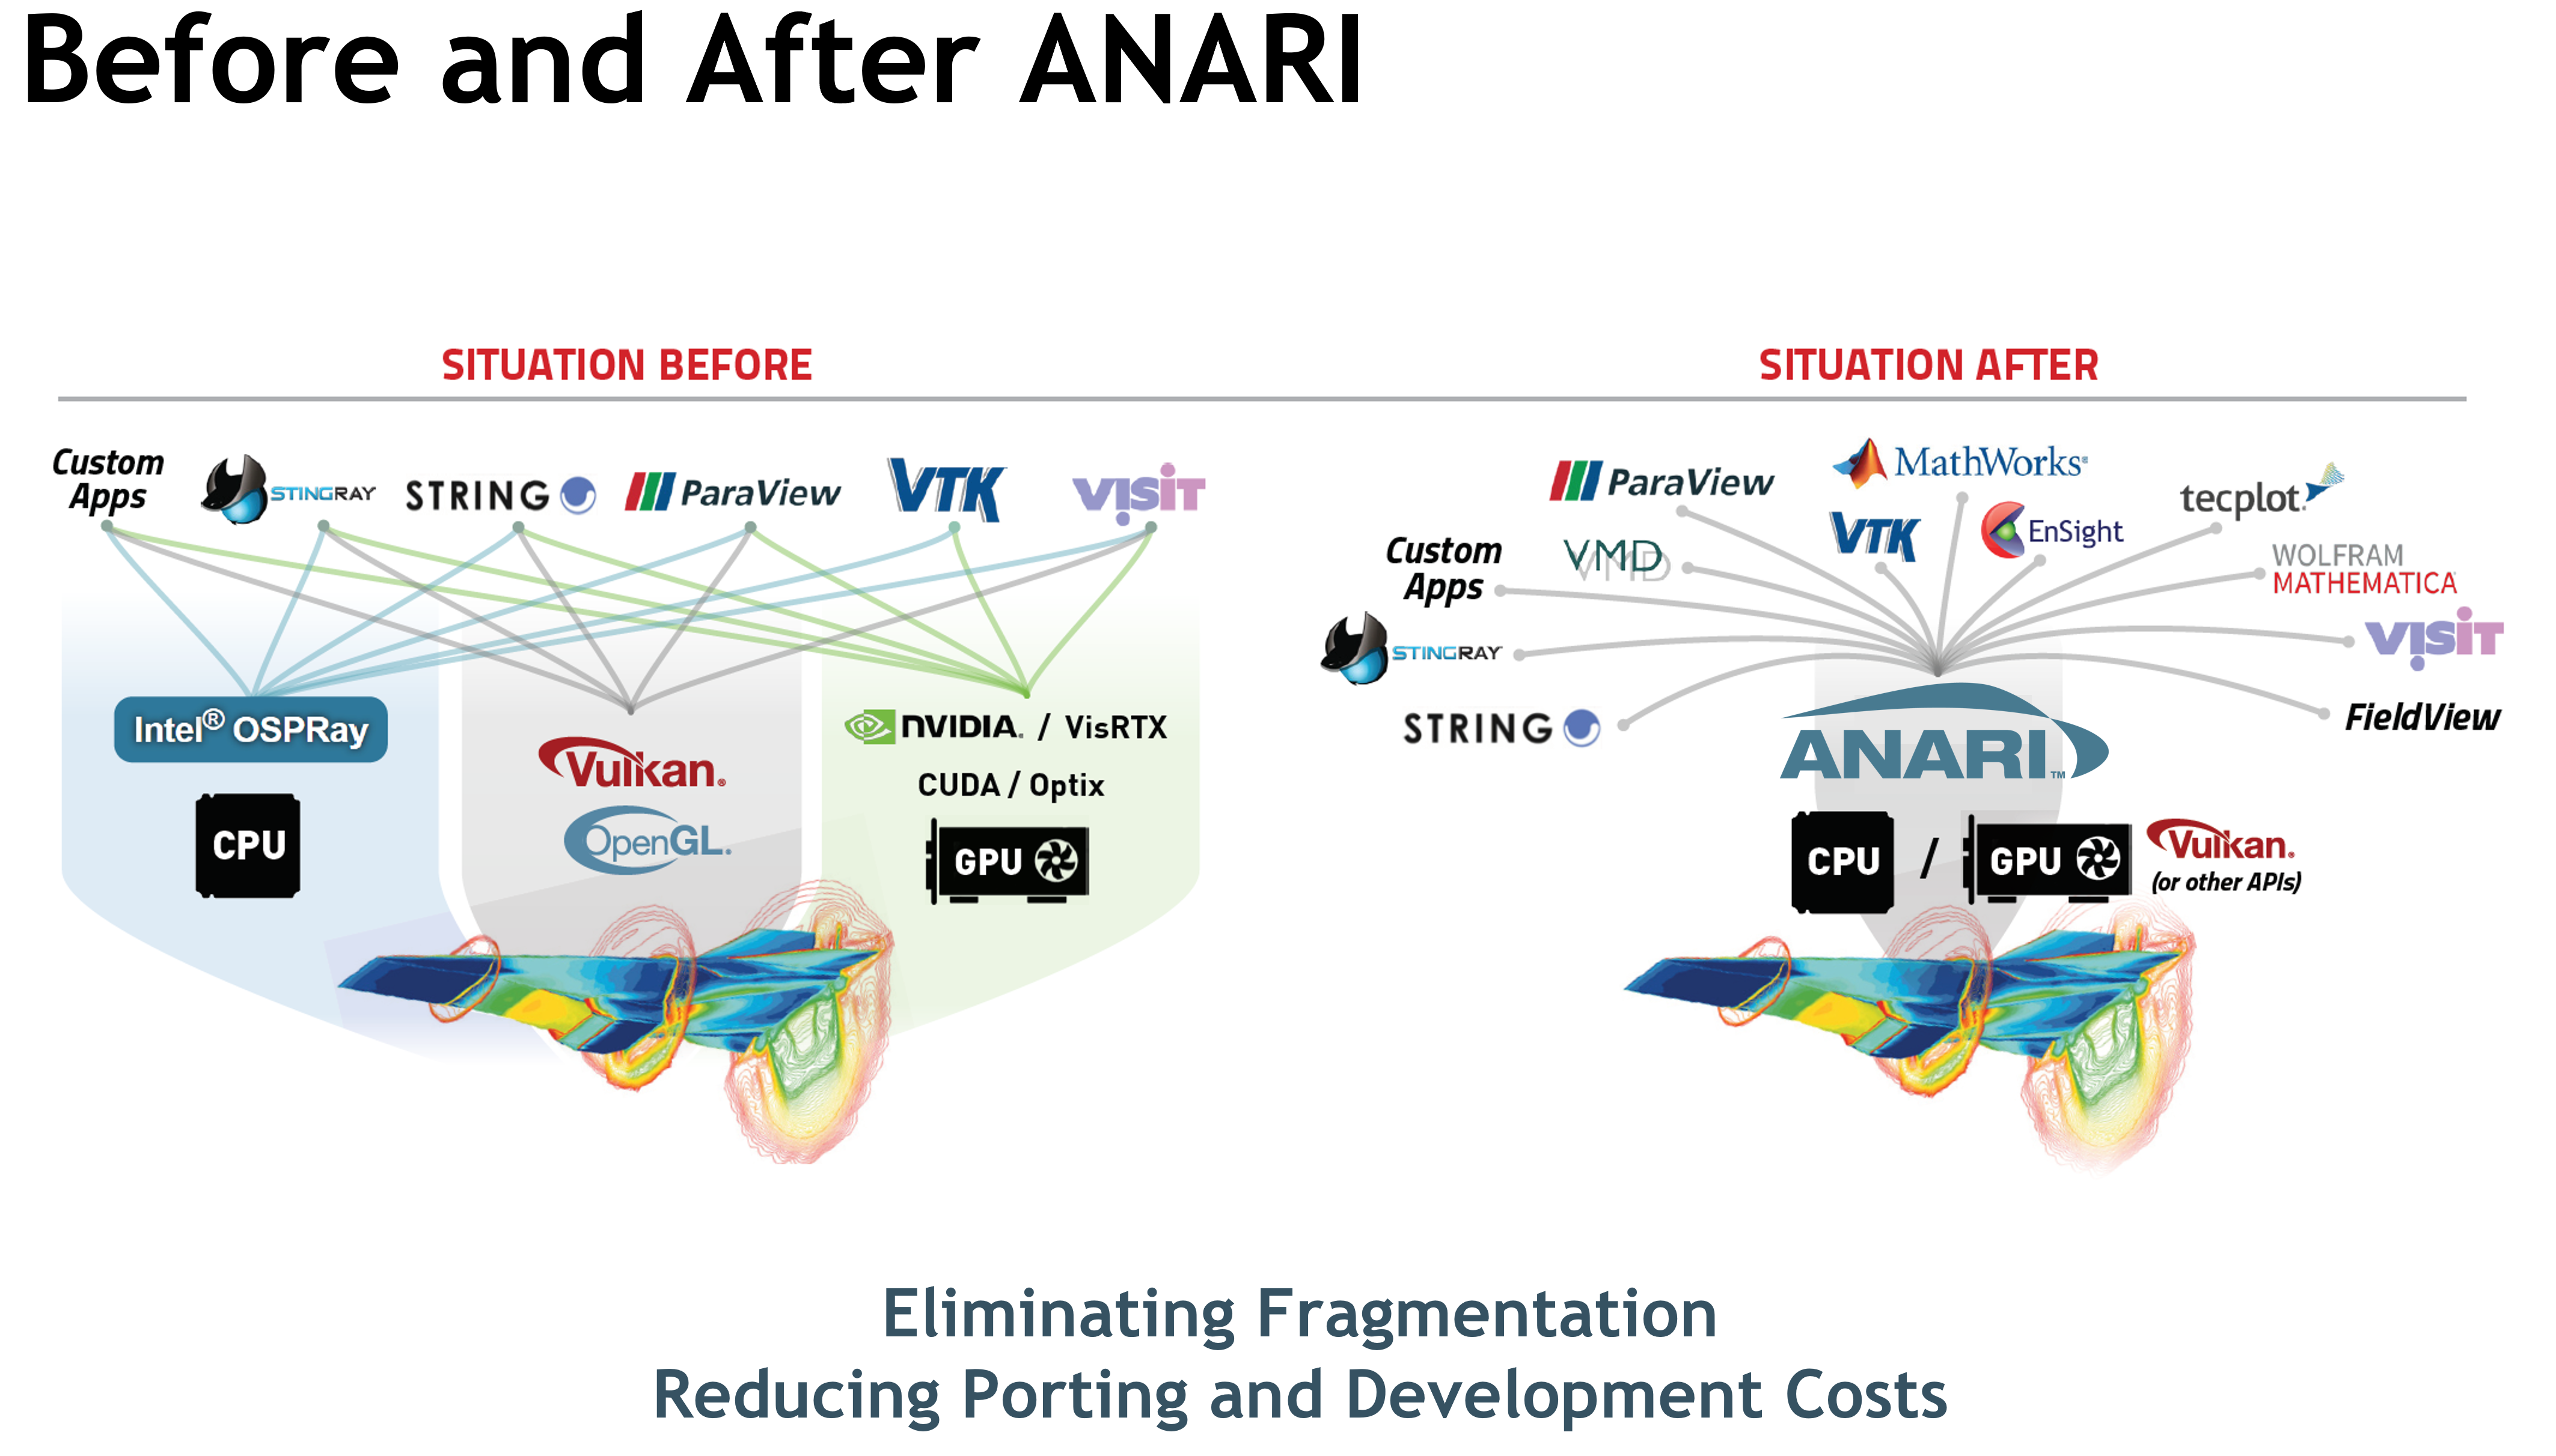
- Advanced rendering using low-level 3D APIs is skill and time-intensive. Writing to them is often outside the core mission for scientists and domain experts.
- Accelerated rendering engines use proprietary APIs, increasing development, and porting time and costs.
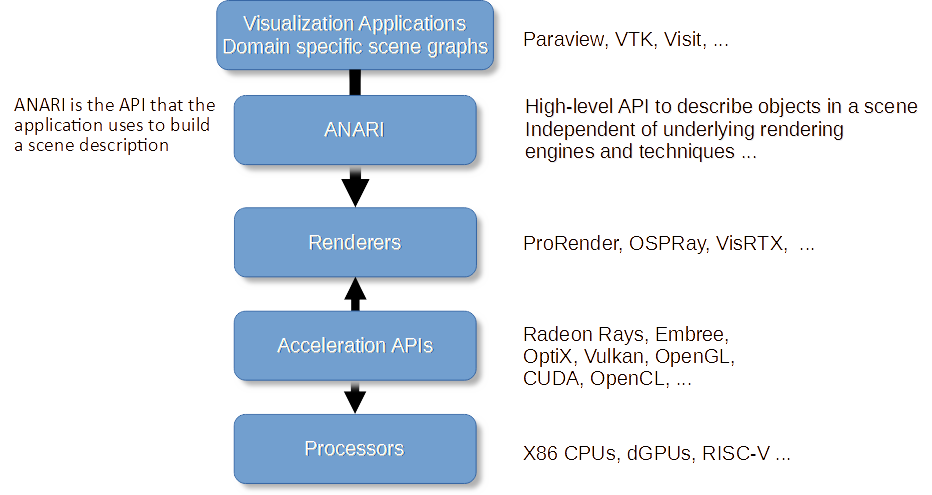
To meet those challenges, Khronos has announced the release of the ANARI 1.0 (Analytic Rendering Interface) provisional open standard API for scalable 3D data visualization.
Khronos’ ANARI will allow users to quickly and easily build a scene description and generate an image from it. Under the covers, the scene description would be converted into USD, and that would provide a pathway to metaverses like Nvidia’s Omniverse.
ANARI doesn’t specify the rendering details; the rendering is left to the backend engine. It will give a simplified way to develop a viz application with cross-vendor portability and enable straightforward use of various rendering engines, including those using ray tracing.
ANARI 1.0 has been released as a provisional specification to incorporate industry feedback before the specification gets finalized. Khronos welcomes comments and feedback from the data visualization community at the specification GitHub repository to ensure that ANARI integrates effectively with existing workflows.
In addition to the specification, the ANARI Working Group has released a collection of open-source software under the Apache 2.0 license to help developers and implementers get familiar with the API. Implementations will become officially conformant when the final specification and conformance tests get released in 2022.
The software includes a simple ANARI implementation with CPU-based ray tracing and no external engine dependencies. There is also a library of small example ANARI applications, an early validation layer for debugging and tracing API calls. And there is a beta release of the ANARI conformance test suite.
As per the directive of Khronos, ANARI is platform-independent and based on C99/C++. It is designed for rendering at any scale of available hardware. Direct coupling with applications enables asynchronous overlap of compute and rendering. And it allows large memory-resident volume and geometry data sets processed in-situ. Runtime querying enables matchmaking of applications to suitable renderers.
What do we think?
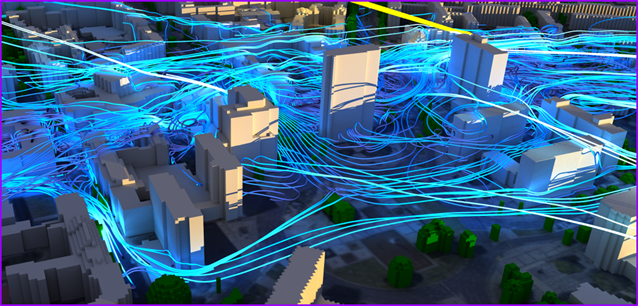
There’s a soft line between scientific visualization and visualizations like architectural and infrastructure interactive renderings. All CAD and PLM systems have visualization capabilities, including global illumination ray tracing. One of the most successful tools for visualization has been Blender.
Scientific visualization is generally involved with large databases. They can only be run on a supercomputer, and that may be the differentiation between simulations and the more common visualizations run on workstations.
Tom DeFanti, one of the developers of scientific visualization in the late 1980s, told me, “with Scientific Visualization, you don’t know what you’re going to see in advance, and what you do see doesn’t usually look like reality. With architectural, engineering CAD, and infrastructure interactive renderings, you are not expecting surprises—although errors are instructive…”
Nevertheless, it will be interesting to see if ANARI will add value beyond its initial focus on scientific visualization, for any developer looking for a simpler, high-level API to render sophisticated imagery.