Consolidated information helps manage VFX, animation, and games projects better.
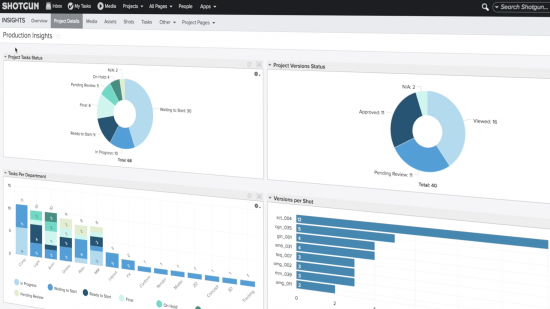
Shotgun Software has released Shotgun 7.6, the latest version of Autodesk Shotgun for digital asset management. This release has introduced Production Insights, a set of analytics and reporting tools that helps studios visualize their production data, in the form of graph types including pie, vertical, line, and horizontal bar charts.
Production Insights amalgamates the information in a form that is easy to understand and helps find out barriers in the workflow. User can go into the details and find out how and where the resources are being used and then optimize operations accordingly.
New features in Shotgun 7.6 include:
- Analytics: optimize use of resources, plan for tight deadlines and budgets, and compile bids for upcoming projects.
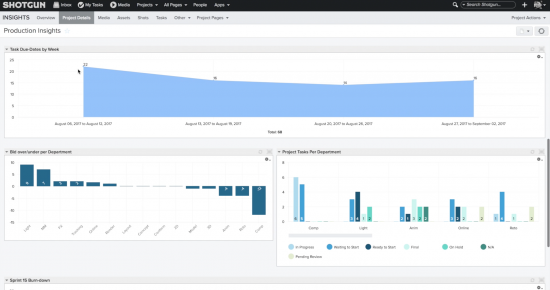
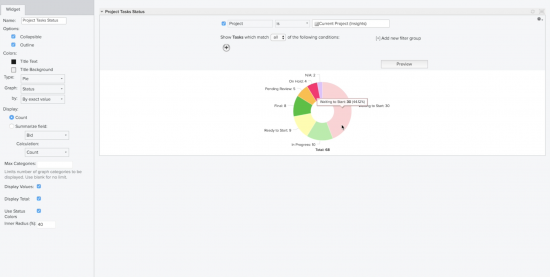
- Data visualization: explore new graph types: pie charts, vertical bar charts, and line charts in addition to the existing horizontal bar chart.
- Data grouping: display data as stacked or unstacked bar charts to visualize in greater detail.
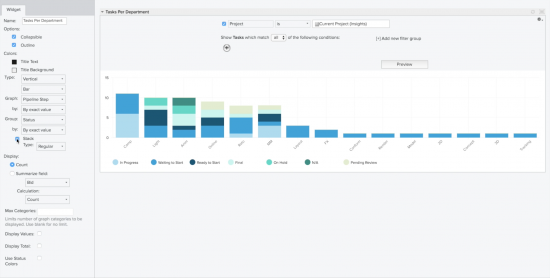
- Presets: drag and drop from several pre-configured presets to build reports quickly.
A 30-day free trial for Shotgun is available. Shotgun pricing starts at $30 per account/month.