If you are looking to buy an AIB for gaming, the RTX 4080 may have the power but it lacks one thing.
Nvidia continues its winning streak with the introduction of the RTX 4080. Priced at $1,200, which seems like a lot of money but is the same MSRP as the RTX 3080 Ti introduced in June 2021, the RTC 4080 is 71% more expensive than the $699 RTX 3080 introduced in September 2020. So, that makes the additional letters, Ti, worth $500. And following that logic, the RTX 3080 Ti, if introduced, will come out next year and should cost $1,700.
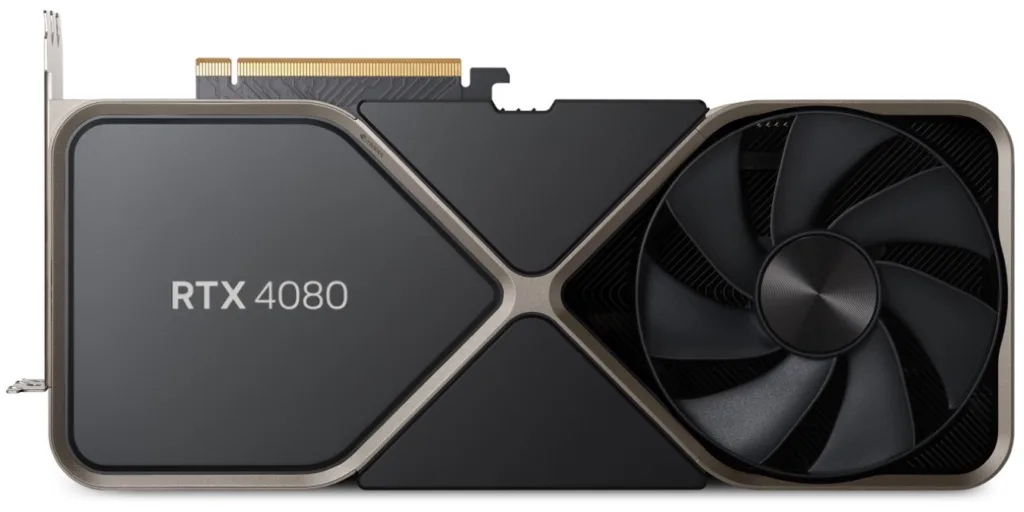
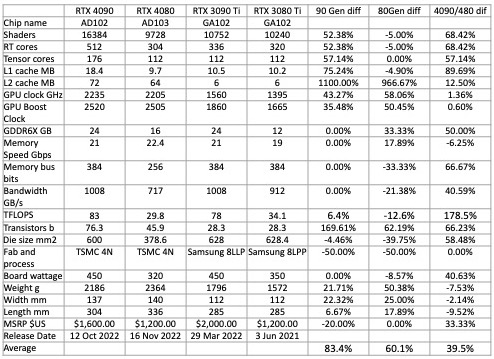
The RTX 4080 is the same physical size as the RTX 4090 introduced in October 2022 but has fewer functional shaders and therefore uses less power (see table 1). With 42% fewer shaders to generate heat, this add-in board (AIB) draws 41% less power. The 4080’s memory bus width has been reduced by 33% and there’s 12.5% less L2 cache. It wouldn’t have made a lot of sense for Nvidia to put a big, and expensive cache in a 2nd-tier GPU. Even though the 4080 has a smaller memory bus (by 33% ), just like the 4090, it’s equipped with the fastest video RAM.
The GeForce 40 series also includes Nvidia’s DLSS 3, a feature that is only available on the new AIBs.
Table 1 summarizes the characteristics of Nvidia’s current and previous generation AIB/GPUs.
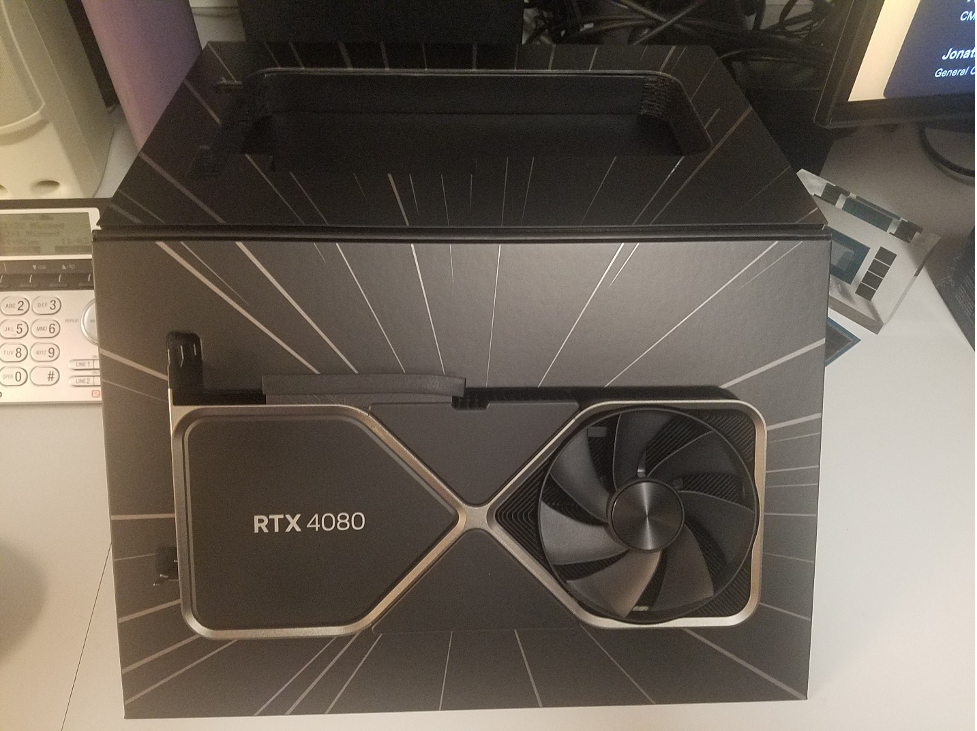
Benchmarking the RTX 4080 Founder’s Edition
We ran a suite of tests on the RTX4080, RTX4090, and RTX3080. The results were rather predictable, but interesting nonetheless. Our test bed was a new Intel gen 13, 24-core, Raptor Lake i9-13900k with 32GB Corsair Vengeance DDR4 3600MHz RAM.
We ran six synthetic benchmarks (Basemark: Relic of Life, DirectX RayTrazcing , Port Royal, Speedway, TimeSpy, and TimeSpy Extreme) for a total of 27 tests per AIB.
We also ran the benchmark programs in 13 games (Assassins Creed: Valhalla, Boundary RT Benchmark, Bright Memory Infinite, Chernobylite: Enhanced Edition, Cyberpunk 2077, Evil Genius 2 DX12, F1 2022, Far Cry 6, Godfall, Metro Exodus Enhanced, Red Dead Redemption 2, Watch Dog: Legion, and Wolfenstein: Youngblood), at 1440 and 4k with quality at ultra or the highest setting for a total of 34 tests per AIB.
Overall, we ran 183 tests on the combination of AIBs. The spreadsheet with the individual scores is available upon request.
We then calculated the Pmark and a few other metrics to compare the AIBs. The summary of the data is shown in Table 2.
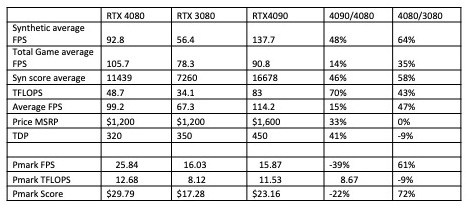
There’s been a lot of discussion about the value and price-performance of the RTX4080 versus other Nvidia AIBs. Whereas the RTX 4090 has 70% greater TFLOPS performance, in games it only provides a 15% improvement, and 48% in synthetic benchmarks. When you factor in price and power the Pmark for TFLOPS shows the 4080 beating the 4090, as does the FPS rating.
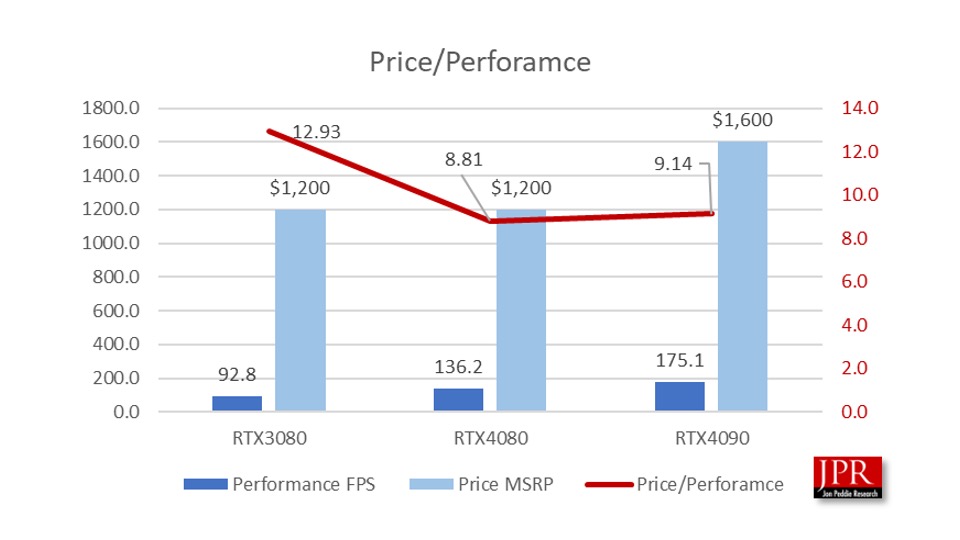
A simple price-performance comparison shows the RTX 3080 being the best.
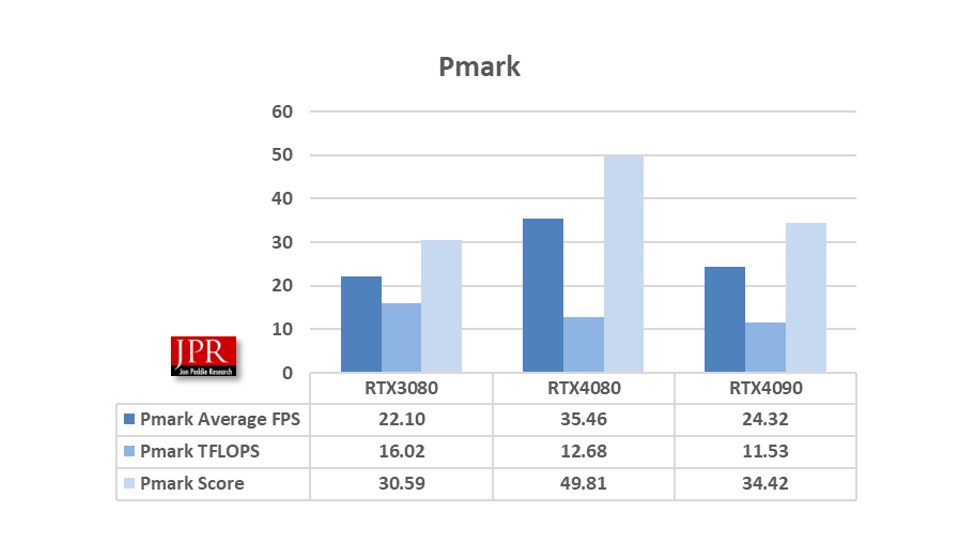
When you incorporate power consumption and calculate the Pmark, you get the following set of data.
Power has been an issue on the RTX AIBs. Nvidia offered some interesting power consumption comparisons. The company said they have been fielding quite a few questions about why the RTX 4080 doesn’t seem to be coming close to the stated TGP specification of 320 W. While TGP is an interesting data point on its own, it doesn’t convey the power consumption a user will experience in normal everyday use.
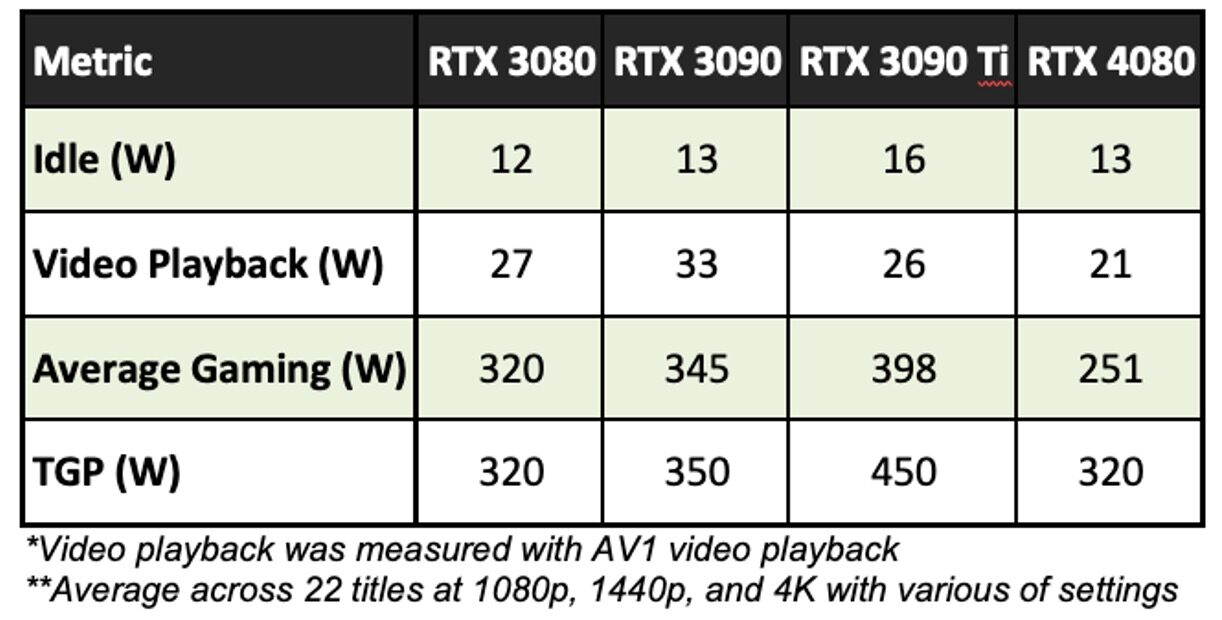
The importance of measuring GPU power consumption
GPU power consumption is just as important as other metrics such as FPS and latency. Testing and averaging power across a range of games and settings will give a more accurate picture of what gamers will actually experience. As an example, in Table 3, is the power consumption for a variety of Nvidia GPUs in various use cases including idle. As you can see, while the TGP of the RTX 4080 is 320W, the GPU actually runs at a wide range of power levels depending on the use case.
The TGP is the power cap limit for GPU Boost. For high-power apps, the GPU power may hit the TGP power cap limit, and the GPU Boost clock will be optimized within the power and thermal limits. However, in cases where the GPU is bottlenecked by the CPU, or the GPU is running light workloads, the GPU’s power consumption may be far less than the TGP. In these cases, the GPU Boost clocks may still hit the GPU’s maximum frequency, and thus the GPU’s efficiency will be maximized. Under most operating conditions, including many gaming workloads, this allows RTX 40 Series GPUs to consume significantly less power than TGP.
Table 4 shows the GeForce RTX 4080’s power consumption running five games at various resolutions:
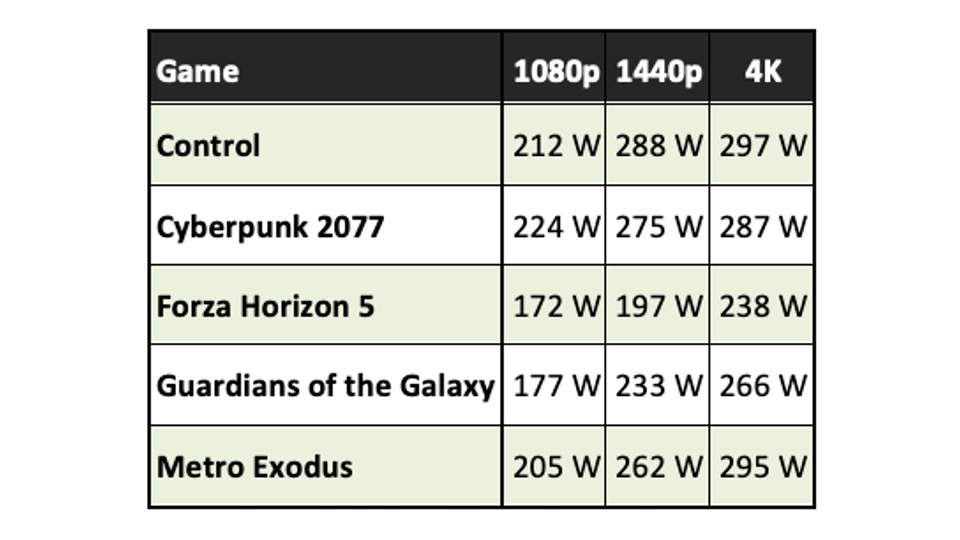
The average power consumption of the GeForce RTX 4080 in the examples above never hits 320W, even at 4K. The RTX 4080 GPU consumes significantly less power at 1080p because, says Nvidia, Ada is much more power efficient. Nvidia’s boost algorithms still increase clocks until they hit a limit. On Ampere, that limit was typically the power limit. But since Ada requires less power overall, it’s hitting other limits first, for example, max clocks/voltage, and Nvidia says it is able to reduce overall power level to conserve energy. Even at 1440p the GeForce RTX 4080’s power consumption is much lower than its TGP power rating. Nvidia says it’s important to understand that every game requires different levels of GPU power, and varies at different graphics settings and screen resolutions. GPU power consumption varies similar to fps over time.
Testing power consumption is easy with RTX 40 Series GPUs. There are two options to get accurate power data from an Nvidia AIB, FrameView software, and Nvidia’s PCAT (Power Capture Analysis Tool) utility and hardware. Both report accurate power consumption numbers for Nvidia AIBs. However, Nvidia claims it’s critical to use PCAT to test non-Nvidia GPUs, as other vendor APIs, says Nvidia, report inaccurate or incomplete power consumption.
What do we think?
If we were to accept specific examples of power consumption for games selected by Nvidia for power consumptions at different resolutions, as suggested from the preceding tables, we would have 15 Pmarks. We didn’t test three of the five games Nvidia chose (we only use games with built-in benchmarks to be consistent. And, it’s a RTX 4080 against itself comparison, so we didn’t do it.
As a result, we think the RTX 4080 is a pretty good board, but not the best. If it were better priced for the market, maybe $999 or less, it would be a winner.