JPR’s Q1’18 Market Watch report on PC GPU shipments is now available.
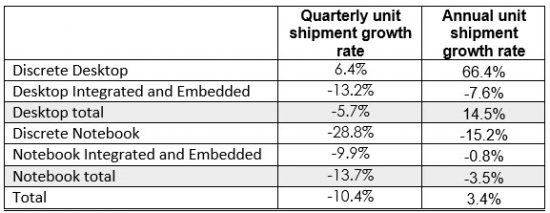
Jon Peddie Research, the industry’s market research firm for the graphics industry, has updated it’s quarterly Market Watch report. Overall, the report finds the cryptocurrency market is continuing to influence the PC graphics market, though its influence is waning. Market Watch found that year-to-year total GPU shipments increased 3.4%, desktop graphics increased 14%, notebooks decreased -3%. GPU shipments decreased -10% from last quarter: AMD decreased -6%, Nvidia decreased -10%, and Intel decreased -11%.
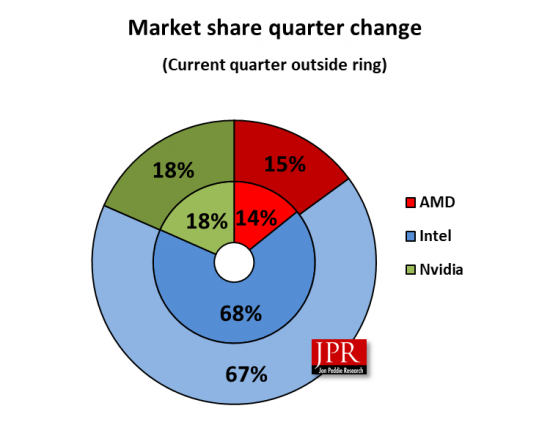
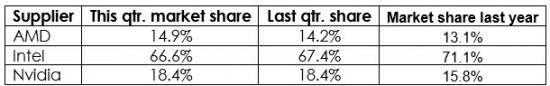
AMD increased its market share again this quarter benefitting from new products for workstations, and cryptocurrency mining, Nvidia held steady, and Intel decreased.
Over three million add-in boards (AIBs) were sold to cryptocurrency miners worth $776 million in 2017. In this first quarter of 2018, an additional 1.7 million were sold.
We believe the market for crypto-mining AIBs has saturated, and the miners who wanted AIBs have got them now. The gamers, who have pulled back on purchases due to surge-pricing by the channel, are seeing supplies increase and prices coming back down. We think there is a pent-up demand among gamers, which will carry forth into Q2 and will help mitigate the usual seasonal decline in the second quarter for desktop discrete GPU sales.
However, the PC suppliers, the supply chain in Taiwan and China, and the semiconductor suppliers are all guiding down for Q2 reflecting a continuation of historic seasonality, and a general decline in the PC market. Nonetheless, the supply chain companies in Taiwan are predicting that this Q2 will be the bottom for the PC market decline.
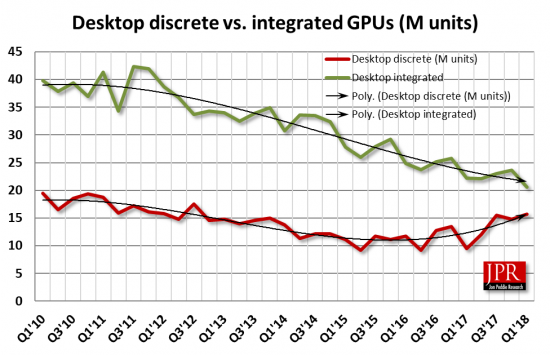
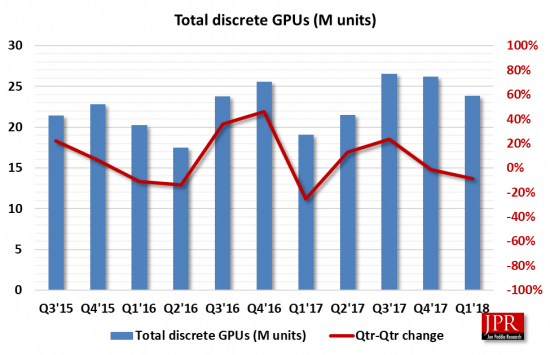
The first quarter is typically flat to down from the previous quarter in the seasonal cycles of the past. For Q1’18, it decreased -10.4% from last quarter and was below the ten-year average of -6%.
Quick highlights
- AMD‘s overall unit shipments decreased -5.83% quarter-to-quarter, Intel‘s total shipments decreased -11.49% from last quarter, and that of Nvidia‘s decreased -10.21%.
- The attach rate of GPUs (includes integrated and discrete GPUs) to PCs for the quarter was 140% which was up 5.75% from last quarter.
- Discrete GPUs were in 39.11% of PCs, which is up 2.23%.
- The overall PC market decreased -14.12% quarter-to-quarter and increased 0.46% year-to-year.
- Desktop graphics add-in boards (AIBs) that use discrete GPUs increased 6.39% from last quarter.
- Q1’18 saw a no change in tablet shipments from last quarter.
GPUs are traditionally a leading indicator of the market, since a GPU goes into every system before it is shipped, and most of the PC vendors are guiding cautiously for Q2’18.
JPR’s detailed 82-page Market Watch report, which is supplied with a massive in-depth spreadsheet, will provide you with all the data, analysis, and insight you need to clearly understand where this technology is today and where it’s headed.
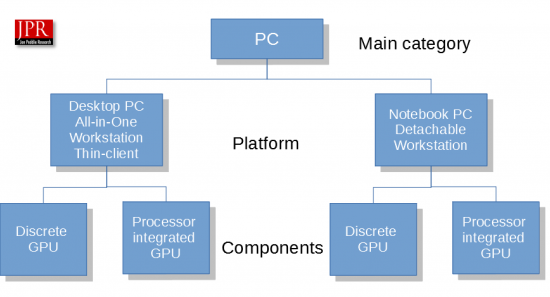
Our findings include discrete and integrated graphics (CPU and chipset) for Desktops, Notebooks (and Netbooks). It does not include iPad and Android-based tablets, or ARM-based servers, or x86-based servers. It does include x86-based tablets, Chromebooks, and embedded systems.
GPUs are traditionally a leading indicator of the market, since a GPU goes into every non-server system before it is shipped, and most of the PC vendors are guiding cautiously for Q2’18. The gaming PC segment, where higher end GPUs are used, was a bright spot in the market in the quarter.
For those who wish to understand the PC market, an understanding of the highly complex technology and ecosystem that has been built around the GPU is essential to understanding the market’s future directions.
The report contains the following content:
- Worldwide GPU and PC Shipment Volume, 1994 to 2020.
- Detailed worldwide GPU Shipment Volume, 1Q 2001 to 2Q 2016, and forecast to 2020.
- Major suppliers: Detailed market share data on the shipments of AMD, Intel, Nvidia, and others.
- Financial results for the leading suppliers: Analysis of the quarterly results of the leading GPU suppliers.
- Market forecasts: You will also be able to download a detailed spreadsheet and supporting charts that project the supplier’s shipments over the period 2001 to 2018. Projections are split into platforms and GPU type.
- GPUs: History, status, and analysis.
- Financial history for the last nine quarters: Based on historic SEC filings, you can see current and historical sales and profit results of the leading suppliers.
- A vision of the future: Built upon a solid foundation of facts, data and sober analysis, this section pulls together all of the report’s findings and paints a vivid picture of where the PC graphics market is headed.
- Charts, graphics, tables, and more: Included with this report is an Excel workbook. It contains the data we used to create the charts in this report. The workbook has the charts and supplemental information.
JPR also publishes a series of reports on the PC Gaming Hardware Market, which covers the total market including system and accessories, and looks at 31 countries. More information can be found here: https://www.jonpeddie.com/reports/pc-gaming-hardware-market-report/.