by Trey Morton
Infinite Jest by David Foster Wallace and The Great Gatsby by F. Scott Fitzgerald are considered classic novels. Each chronicles the hopes, fears, ambitions and foibles emblematic of its times. But it takes Wallace 1,100 pages and 577,000 words to tell his story, while Fitzgerald tells his in only 180 pages and 47,000 words. There’s little argument that both get the job done.
Developing workstation performance benchmarks might seem a far reach from writing a novel, but in every benchmark result there is a story to be told. Leave out a large model, truncate the functionality, shorten the testing time, or boil down the results to a single number and you’re leaving out key plotlines that might better illuminate the story. If the benchmark is a good one and the application is complex, it might take some time and dozens of results for the story to reveal itself.
Novel, novella, or short story?
The flip side of novel-sized workstation performance testing is a benchmark that is more of a short story or novella, giving users a glimpse of performance for specific functionality or tasks rather than a more comprehensive picture that aligns closely with users’ day-to-day work.
While brevity has its benefits, it has drawbacks for those wanting representative performance numbers for systems running an application over a longer period of time. A feature such as turbo boost, for example, cannot usually be sustained over a longer run time. If the benchmark finishes with turbo boost engaged during the entire run time, it will almost certainly give a false impression of performance. The shorter run-time also might obscure the advantage of thermal solutions that allow systems to run longer at full capacity.
Although longer run times allow for bigger, more complex models and the ability to measure many different types of functionality, they are not always intrinsically better. A benchmark workload might be running too long because of multiple tests that are exercising the same functionality with very similar results. Or, there could be a very large model or assembly that exercises the GPU and CPU, but might not be indicative of something that would be created by real users working within a particular application.
The key is to know when the sweet spot is reached; where adding more tests or models does not provide any more useful information.
Back to the classroom
The trade-offs between realism and run time were made clear to me recently by some experimentation with the Blender workload within the SPECworkstation benchmark.
Blender is free and open-source software for 3D media and entertainment (M+E) applications. I was trying to see how the run time within the workload could be reduced while still revealing key performance differences among diverse workstation configurations.

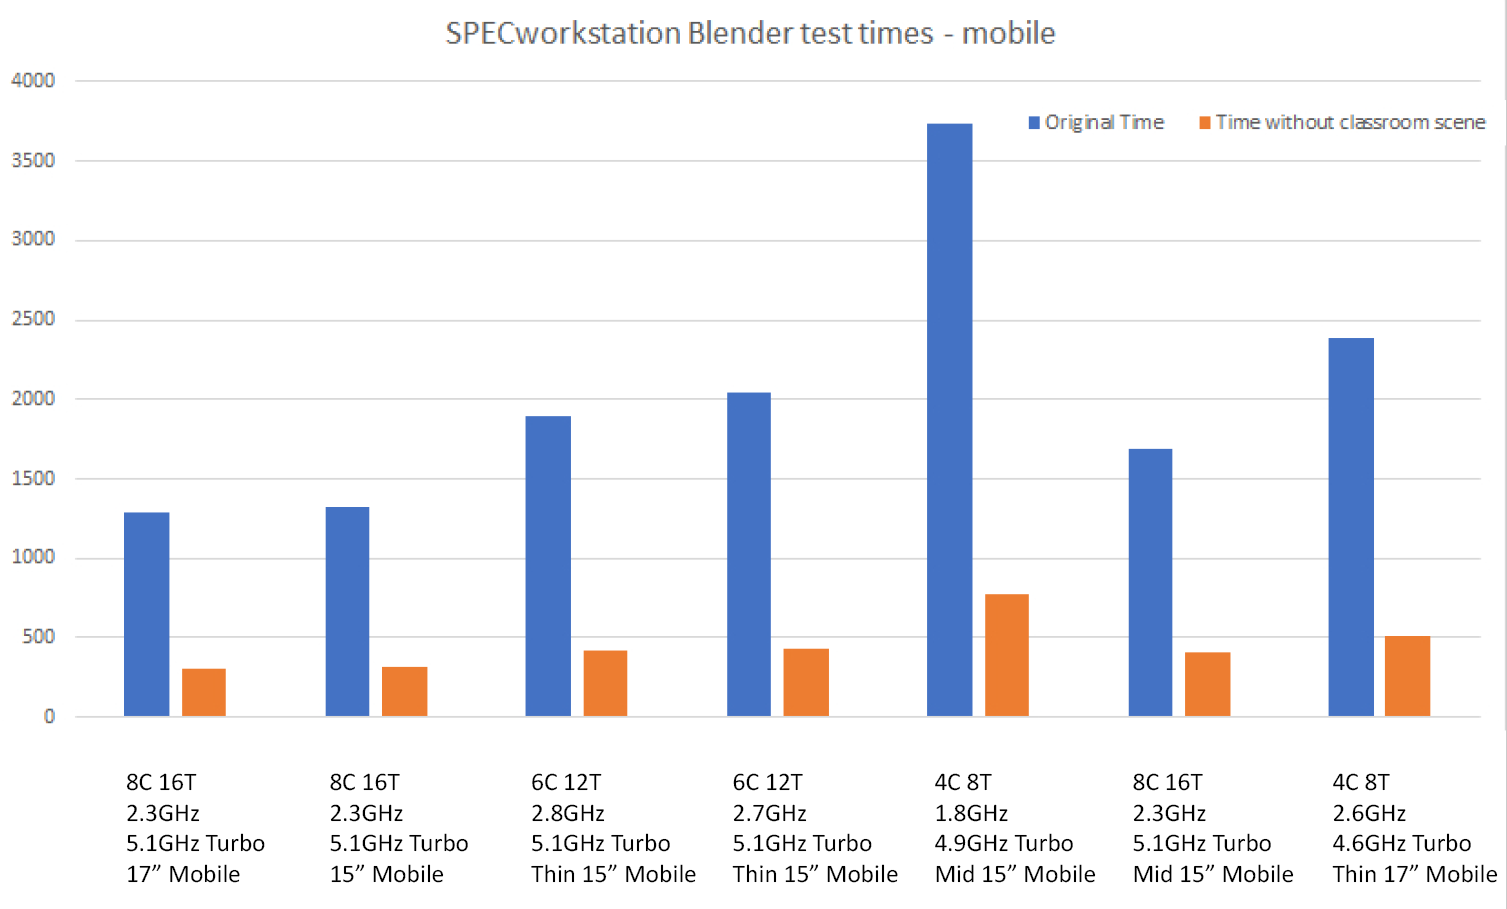
Due to COVID-19, I was working at home with a full table of mobile workstations ranging from thin-and-light to the equivalent of desktop replacements. I started running the Blender CPU-based tests and observing the results. I noticed that the classroom scene took much longer to render than other scenes within the workload – in some cases, 20 times longer.
The classroom scene presents a complex, computationally intensive rendering scenario. It comprises three composited layers—a base layer containing all the objects in the scene, a middle layer for dust particles, and a top layer for volumetric lights—and lots of objects rigged for animation. There are multiple light sources and bounced lights, including light passing through a window and emanating from overhead light fixtures.
I decided to remove the classroom scene from the benchmark and examine the effect it would have on test duration and results. The modified workload ran anywhere from around five to almost seven times faster with the classroom scene removed. When normalized against the reference machine, the resulting scores exhibited remarkable consistency.
Mission accomplished? Not so fast, grasshopper. The results were encouraging, but I knew that this was only one chapter in the story.
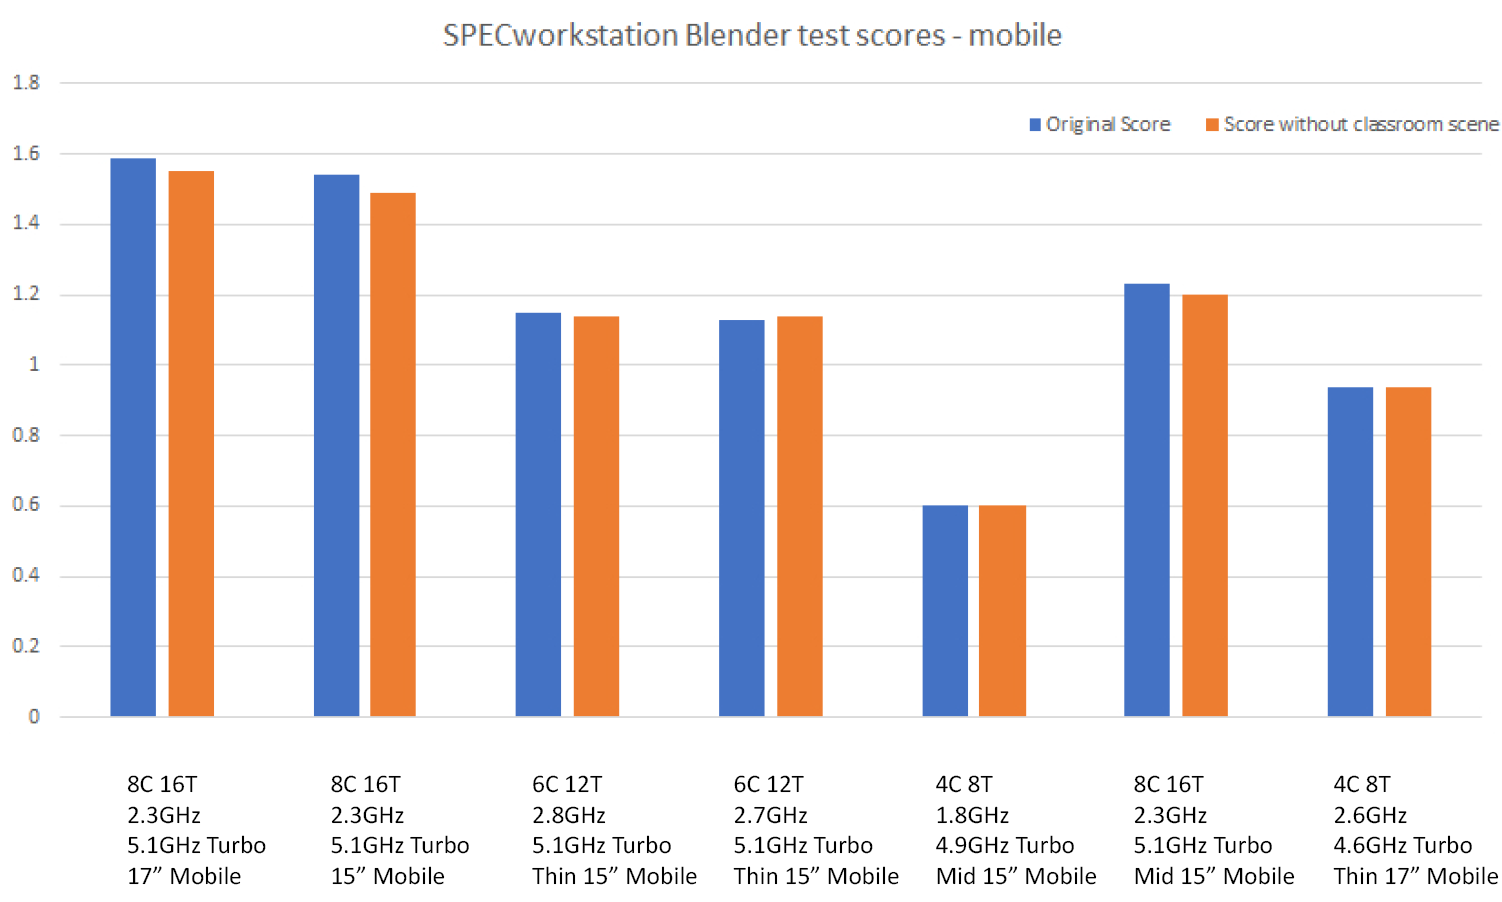
To get the full story, I knew I needed to get results from a selection of higher-end desktop workstations. Due to working from home I didn’t have a large selection of desktop systems available, but I did have access to SPECworkstation benchmark results pages on the SPEC website. I pulled the Blender results from desktop systems (single and dual socket) and looked at the results without the classroom scene. It was clear after comparing the desktop results to the mobile results why the classroom scene is critical to providing comprehensive performance results among the full range of professional workstation offerings.
Without the classroom scene, the Blender workload did not have tests with enough complexity to show the advantage of both large amounts of cores and dual-socket configurations. These are typical desktop workstations and to not illustrate their performance characteristics would be a disservice to our customers and users.
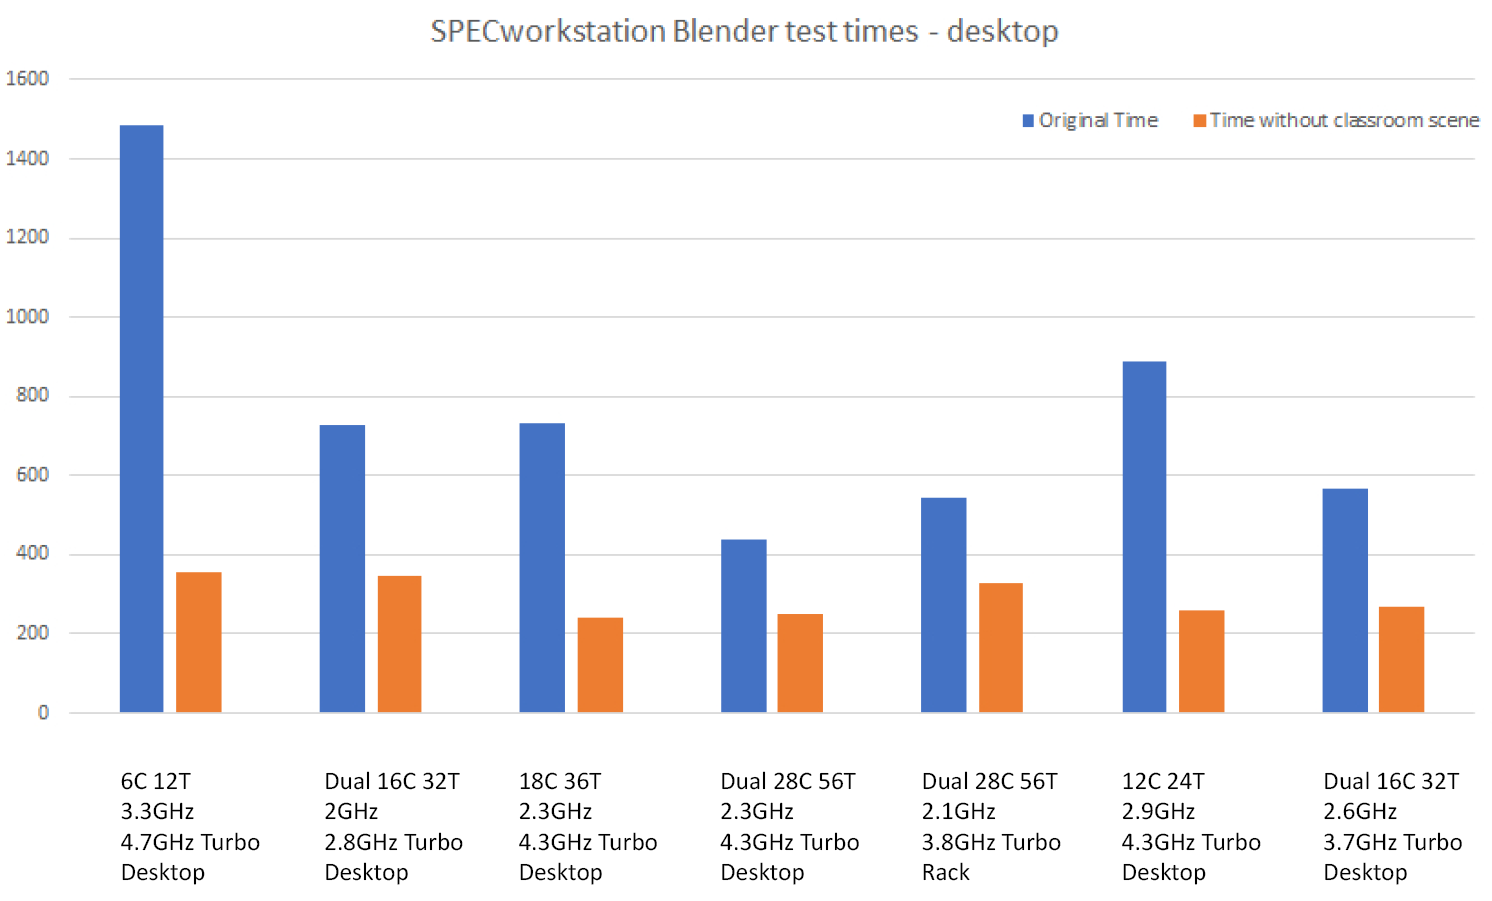
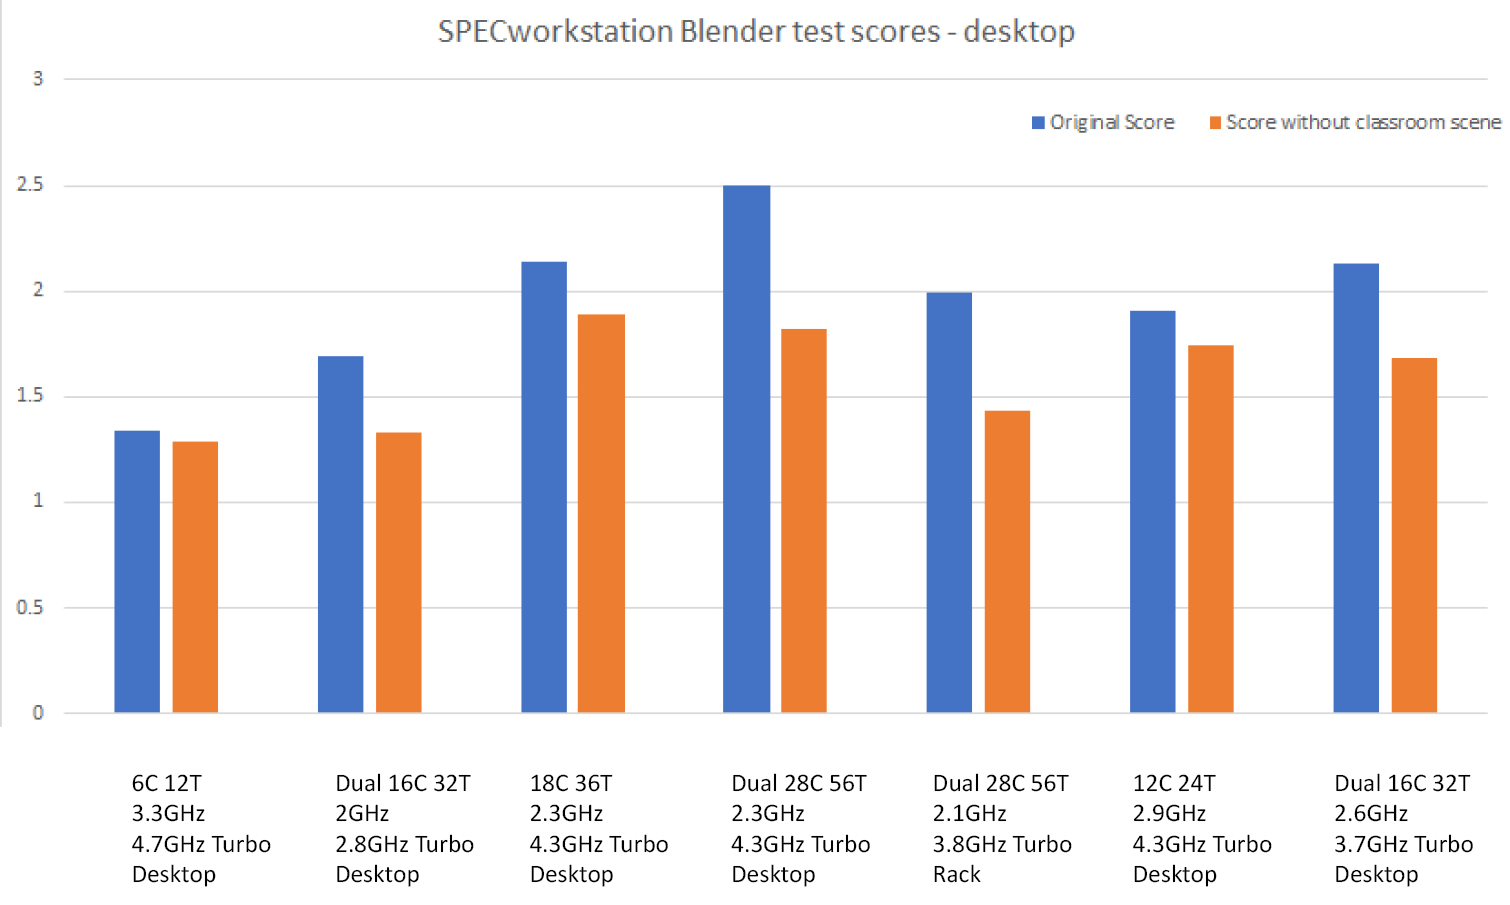
Without the classroom scene, the Blender workload did not have tests with enough complexity to show the advantage of desktop systems with both large amounts of cores and dual-socket configurations.
Application differences matter
The lesson learned, at least from a SPECworkstation perspective, is that while everyone would like a benchmark that runs quickly and can be boiled down to one or two numbers, those types of benchmarks rarely give an accurate and complete picture of true application performance. Workstations are used in so many different markets in so many different ways that the one-size-fits-all concept doesn’t even work for measuring performance within a single application, much less across an entire discipline such as product development or media and entertainment.
Just think of the many different ways an application like Maya is used and how performance is affected by specific market demands, whether it is special effects for cinema, modeling and animation for gaming, or interactive architectural modeling and walkthroughs.
Within a CAD/CAM application such as Solidworks, models vary widely in size and complexity; in how they are constructed for downstream processes such as FEA, CFD, and VR; and how the model will ultimately be manufactured, whether by CNC machining, injection molding, sheet-metal cutting, 3D printing, or another process.
Each application has distinct features and workflows and the goal of a good benchmark should be to measure the critical functionality that’s specific to that particular industry and application. But, that doesn’t mean that users need to pay attention to every aspect of a benchmark or every result it generates.
Freedom of choice
Within SPEC/GWPG benchmarks there are different options for assessing performance without running the entire benchmark and examining all of the results:
- SPECapc benchmarks can be run by licensed users of applications to obtain a comprehensive look at all areas of workstation performance. Within this wide-ranging performance coverage, users can zero in on specific tests that are most applicable to their work. SPECapc benchmarks are available for 3ds Max, Creo, Maya, NX and Solidworks.
- For those interested in graphics performance, workloads (called viewsets in SPECviewperf) can be examined within the SPECviewperf or SPECworkstation benchmarks, neither of which requires the actual application to be installed on the system under test. Although both benchmarks comprise a range of applications and targeted industries, users have the option to run only the tests specific to their work.
- Those who are interested in specific aspects of performance but don’t have access to different systems for testing can refer to results on the SPEC website.
Why SPEC/GWPG?
Beyond the performance coverage of the benchmark and how long it takes to run, users should pay attention to the source of the benchmark. Is it a private company hired by a vendor for testing? What are the qualifications of the benchmark developers? Is there transparency in how the results are derived? Who uses the benchmark and how?
Several key qualities have garnered trust around the world for SPEC/GWPG benchmarks:
- They are developed by knowledgeable technical engineers from leading graphics and workstation vendors, including AMD, Dell, Fujitsu, HP, Hypertec, Intel, Lenovo and Nvidia.
- They are based on actual applications and commonly used functionality, helping to ensure that performance results will translate to the real world.
- They generate results that are transparent and repeatable.
- They are used and endorsed by leading publications and R&D companies in their reviews of new hardware.
- Because the developers are ardent competitors in the marketplace, there is a system of checks and balances that helps ensure a level playing field.
- SPEC/GWPG members use the benchmarks themselves to develop products based on objective performance information and to communicate competitive advantages to the marketplace. It’s always a good sign when developers use their own products.
Ideally, a benchmark organization such as SPEC/GWPG could meet all of its goals with the terse efficiency of The Great Gatsby, but the demands of modern applications and the inexorable march of technology might mean dipping into Infinite Jest or War and Peace territory from time to time. After all, like a good author, we benchmark developers are in service to the performance story.
Trey Morton is chair of the SPECapc subcommittee and a performance engineer in the Dell Client Solutions Group.
For more information about graphics and workstation performance, visit the SPEC/GWPG website, subscribe to the SPEC/GWPG enewsletter, or join the Graphics and Workstation Benchmarking LinkedIn group: https://www.linkedin.com/groups/8534330.