It’s that time again.
By Bob Cramblitt
Your CAD package or 3D animation software is running slower than you think it should when confronted with heavy graphics content. Response time is lagging, slowing productivity. It might be a trivial issue if it affected only one system, but when multiple highly paid designers, engineers, or animators are being slowed down, it becomes something bigger.
As you set about shopping for new graphics cards or workstations to address these issues, it could be beneficial to use a professional-level graphics benchmark as part of your decision-making process. A rigorous benchmark can be used to evaluate new systems that will increase graphics performance and enable your best and brightest to perform their tasks faster and more efficiently.
In the first of a three-part series, we’ll outline what’s behind the performance numbers from SPEC Graphics and Workstation Performance Group (SPEC/GWPG) benchmarks. We’ll start off with SPEC/GWPG’s most popular benchmark, SPECviewperf. The benchmark is free to all but computer vendors and has been downloaded more than 10,000 times annually.
SPECviewperf and what it measures
The SPECviewperf benchmark measures graphics performance for systems currently running under the OpenGL and DX application programming interfaces (APIs). It is developed and maintained by the Graphics Performance Characterization (SPECgpc) group.
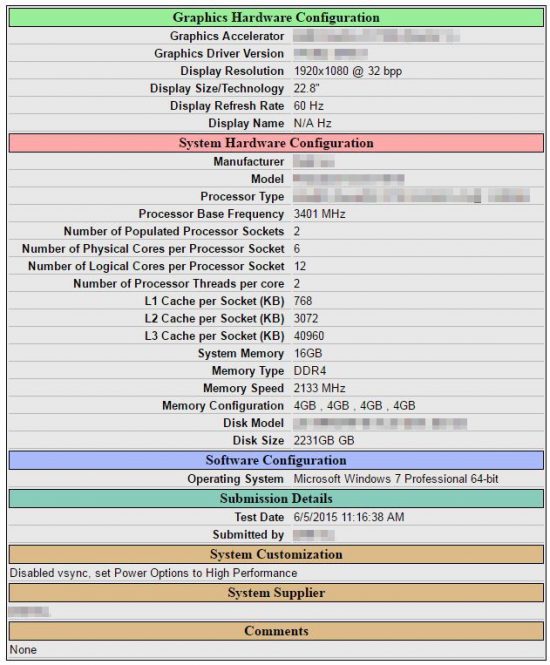
SPECviewperf results posted on the SPEC website come from vendors and other parties running SPECviewperf under run rules established by SPECgpc. The results undergo peer review by SPECgpc members and, if accepted, they are posted on the website along with detailed information on the system configurations that were tested. The detailed configuration information helps ensure that others are able to recreate the same performance as that documented on the SPEC website.
How to use the posted results
SPECviewperf results posted on the SPEC website provide a wealth of information on graphics performance for various system configurations. Here are the steps that Alex Shows, SPECgpc chair, recommends to make the most of these results.
Step 1
Go to the SPECviewperf results page.
Step 2
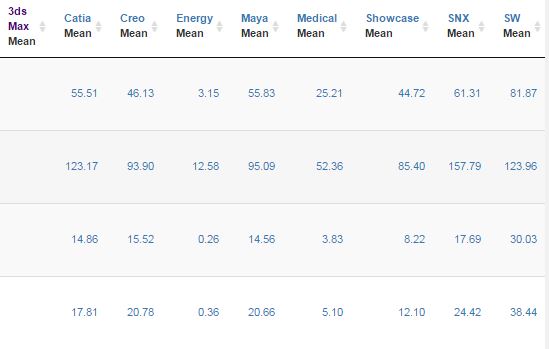
Look across the top of the results table and see the different applications represented by SPECviewperf viewsets. Viewsets are the benchmark’s workloads, which use graphics content and behavior extracted from actual applications.
- Don’t see your application? Think about what class of application (i.e., CAD/CAM, 3D animation, visualization, energy, medical) you’re using and find a viewset from an application that is most similar.
- Still don’t see a match? Send feedback to SPEC about the graphics application you would like to see benchmarked.
Step 3
Look at the column for the viewset that most closely aligns with your own application and compare the performance results for various systems and graphics cards.
- The numbers are a composite of frames per second across many different model complexities and rendering modes.
- The higher the frame rate, the more interactivity you’re likely to have when running your application—your models will animate more smoothly and transform faster as you’re manipulating them on screen.
Step 4
Determine the type of performance on which you want to concentrate.
- Are you interested in system performance? If you’re looking at a 15” mobile workstation, for example, or a desktop that supports a certain GPU, you’ll want to open a few tabs for the products listed in the left column. Right-click on a product name link and open in a new tab. This makes it easier to flip between tabs. Using this tab view, you can easily compare composite scores as well as system configuration details.
- Are you interested in GPU performance only? Comparing GPUs is easy, because they’re listed in the left-most “Company/Product” column. But you might also want to look at things like the submission date to find the results that reflect the most recent performance measurements.
Step 5
Dive deeper into the results.
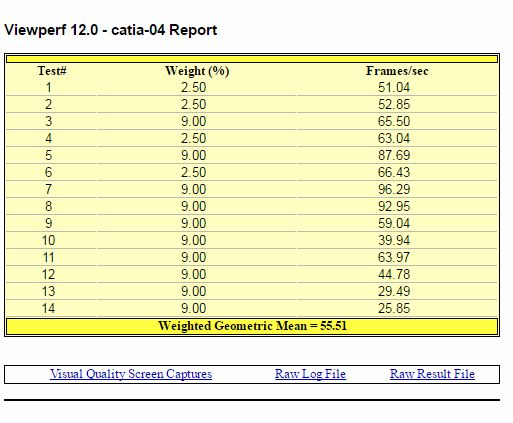
- Composites are just the beginning. The results in the detail page document frame rate measurements for each viewset.
- Each viewset contains multiple tests, where each test represents the measured frame rate of a model/scene and a particular rendering mode. Links to descriptions of the tests for each viewset can be found at the bottom of the SPECviewperf description page. A description for the tests in the catia-04 viewset shown below, for example, can be found on this page: http://www.spec.org/gwpg/gpc.static/catia04.html.
- Think about the complexity of your models/scenes, and the rendering modes you typically use in your work, and then take a look at the viewset’s screen grabs to get a visual accounting of image accuracy.
- Take a look at the viewset’s tests that most closely match how you use the application, and make comparisons of those subscores rather than just the composites, because these will more closely represent your usage.
Remember the big picture
While performance is a major factor in determining choices for new hardware for your most frequently used professional graphics applications, it might not be the end-all and be-all. Vendor reputation for innovation, quality, support and reliability might also factor into any purchasing, configuration, or upgrade decision.
Bob Cramblitt is communications director for SPEC. He writes frequently about performance issues and digital design, engineering and manufacturing technologies. To find out more about graphics and workstation benchmarking, visit the SPEC/GWPG website, subscribe to the SPEC/GWPG enewsletter or join the Graphics and Workstation Benchmarking LinkedIn group: https://www.linkedin.com/groups/8534330.