Detailed configuration information helps recreate the same performance as that documented on the SPEC website.
By Bob Cramblitt
A lot has been written about the movement of applications to the cloud, but if you are involved in tasks that demand outstanding GPU, CPU and/or storage performance, you likely rely on a professional-level workstation.
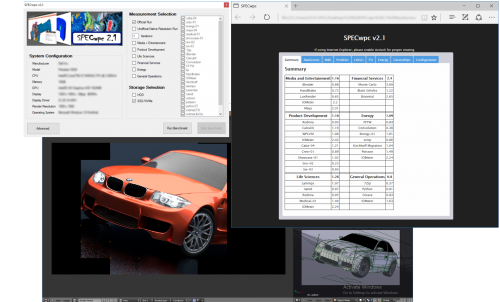
The SPEC/GWPG group recognized the need to evaluate performance of these vital productivity tools when it established the Workstation Performance Characterization (SPECwpc) group. The group’s SPECwpc benchmark measures key aspects of workstation performance based on diverse professional applications.
The SPECwpc benchmark can be downloaded for free to anyone who is not a vendor of computer products and services. Vendors of computer products and services can license the benchmark for $5,000.
Fast, convenient performance results
SPECwpc is a self-contained benchmark and doesn’t require a license for the applications on which its tests are based. Thousands have downloaded the benchmark to use for performance evaluation. But if you want something faster and more convenient, you can access the SPECwpc benchmark results on the SPEC website.
SPECwpc results posted on the SPEC website come from vendors and other parties running the benchmark under run rules established by SPECwpc. The results undergo peer review by SPECwpc members and, if accepted, they are posted on the website along with detailed information on the system configurations that were tested. The detailed configuration information helps ensure that others are able to recreate the same performance as that documented on the SPEC website.
How to use the results
Step 1
Go to the SPECwpc results page.
Step 2
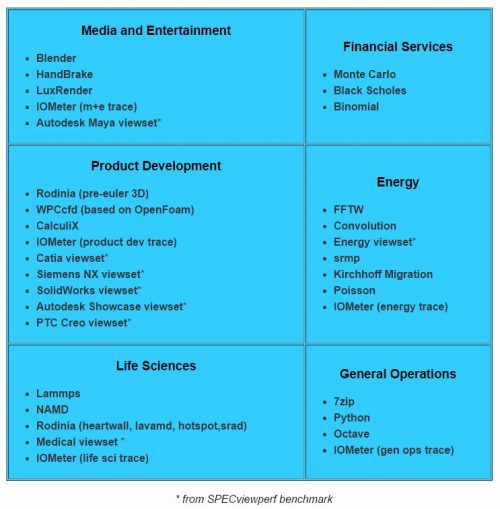
Look across the top of the results table and see the workstation configurations for which results are available and the scores for each application category. Application categories include media and entertainment, product development, life sciences, financial services, energy, and general operations.
Step 3
Look at the column for the category that most closely aligns with your own application and compare the performance results for the different workstations whose results are posted.
- The numbers are composites based on multiple application-based tests across many different model complexities.
- The higher the score, the more quickly and easily you’ll be able to complete your tasks—your models will animate more smoothly and computations will complete in less time.
Step 4
Examine the results for specific workloads within the application category that best matches the applications you use frequently. The workloads represent popular applications within that category and are designed to test CPU, graphics, I/O, and memory bandwidth. The complete list of applications represented in each category is shown below. Many of the graphics workloads come from the SPECviewperf benchmark.
Individual scores are generated for each workload test and a composite score for each category.
Step 5
Dive deeper into the results.
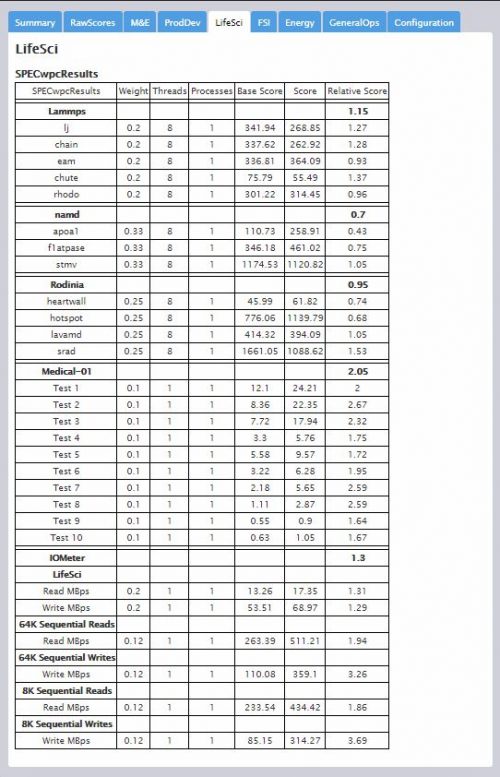
- Composites are just the beginning. The results in the detail page provide individual test scores for each workload. An example of detailed results for Life Sciences tests is shown below.
- Methods for determining individual test scores vary, but the composite score is always a “bigger is better” result. In some cases, individual test scores represent frame rates or operations per second, where a higher number is better. In other cases, test scores represent run time, where a lower number is better. All test scores are normalized against a reference machine, leading to a “bigger is better” composite result.
- Take a look at the results for tests that most closely match how you use the application, and make comparisons of those subscores rather than just the composites, because these will more closely represent your usage.
Keep up to date
SPECwpc performance numbers are submitted for review and publication on a fairly regular basis. So, if you haven’t visited the SPECwpc results page for a few months, there are likely new configurations for consideration.
Bob Cramblitt is communications director for SPEC. He writes frequently about performance issues and digital design, engineering and manufacturing technologies. To find out more about graphics and workstation benchmarking, visit the SPEC/GWPG website, subscribe to the SPEC/GWPG enewsletter or join the Graphics and Workstation Benchmarking LinkedIn group: https://www.linkedin.com/groups/8534330.